Case study · No. 02 · SaaS · cloud · 2025
Cloudixy: a cloud console that tells you what is happening before you ask
A cloud platform for small teams: deploy, monitor and pay from one dashboard, with a marketing site, a guided onboarding, the customer console and the on-call team's internal console.
- Product UX
- Dashboard
- Design system

- Role
- Product designer, from research to prototype
- Duration
- 12 weeks
- Team
- Concept project, solo
- Platform
- Web, desktop
- Tools
 Figma
 Miro
 Google Meet
 Google Docs
- Deliverables
- Benchmark, Proto-personas, User flows, Wireframes, Light and dark design system, 34 screens, Prototype
The project in numbers
What was delivered, counted in the Figma file. A fictional product: no usage results.
34
screens
Site, onboarding, customer console, and 3 internal console screens
82
variables
Colours, spacing and radii, in light and dark modes
343
prototype links
Five linked journeys, from the site to incident handling
01 · The project
The cloud, without becoming ops
Worldwide public cloud spending was set to reach $723 billion in 2025, a fifth more than in 2024. Much of it comes from teams with no infrastructure engineer and no time to lose in consoles built for experts.
Cloudixy is a platform for those teams: push your code and the service is live, with autoscaling, backups and encryption already on. The dashboard says what happened today, what the month costs, and what to do next.
The project covers the whole cycle: the site and pricing, onboarding, the console (services, deployments, logs, security, billing, team), and the internal console where the on-call team runs an incident and tells customers.
Twelve weeks, three spaces
01 · Weeks 1–3
Discover
A review of four families of cloud offers, their dashboards and status pages.
- Benchmark
- Desk research
02 · Weeks 3–4
Define
Two proto-personas, the customer and the on-call engineer, the experience map of a first deployment.
- Proto-personas
- Journey map
- HMW
03 · Weeks 4–6
Ideate
Console architecture, the flow for creating a service, wireframes.
- Information architecture
- User flow
- Wireframes
04 · Weeks 6–11
Prototype
A two-mode design system, charts, 34 screens, a prototype linked in five journeys.
- Design system
- Data visualisation
- Figma prototype
05 · Weeks 11–12
Check
Empty, loading and error states, a review against UX laws, a test plan.
- Heuristic review
- Test plan
02 · Discovery
A huge market, built for experts
$723 B
public cloud spending in 2025
Worldwide forecast, up from $596 billion in 2024.
3 to 15
people in the target team
Developers, no dedicated infrastructure engineer.
Hypothesis
< 2 min
from push to live service
The promise the product must keep, and show.
Hypothesis
Four families of offers
Named by family rather than by brand: each answers part of the need.
| Criterion | Cloudixy · the projectThe project | Large public cloudHyperscaler | Hosting platformPaaS | Frontend cloudSpecialist | Rented serverIndirect |
|---|---|---|---|---|---|
| Go live from a push | Yes | PartlyDepends on the service | Yes | Yes | NoHome-made scripts |
| The month's cost, readable | YesOn home | PartlySeparate billing console | Partly | Partly | YesFlat fee |
| Autoscaling without setup | YesDefault thresholds | PartlyTo configure | PartlyDepends on plan | Yes | No |
| Incidents explained to customers | YesStatus and banner | Yes | Yes | Yes | No |
| A region near the Maghreb | YesCasablanca, Paris | PartlyEurope | PartlyEurope | Not documented | YesLocal host |
The table scrolls sideways.
A desk review of public offers, verdicts simplified by family.
Takeaway
Power sits with the big players, simplicity with the specialists, readable costs with nobody. Cloudixy aims at all three, for teams that don't want to choose.
03 · Definition
The one who deploys, the one who watches
Proto-personas: hypotheses to validate in interviews; their quotes are illustrative.
P1 · the customer
Mathis, 34
CTO of a young logistics company, six developers, eight services in production
- Goal
- Ship without becoming ops, and know what the month costs
- What gets in the way
- Unreadable cloud bills, 3 am alerts without context
« I want to know in a minute whether all is well, and what it costs. »
P2 · on call
Julien, 31
Reliability engineer at Cloudixy, on call one week in four
- Goal
- Understand an incident and warn affected customers within minutes
- What gets in the way
- Scattered tools: alerts, chat, status page, emails
« During an incident, every extra window costs minutes. »
A first deployment, without a platform
Mathis
01Sign up
02Choose
03Configure
04Deploy
05Live
06The bill
Does
Thinks
Feels
Opportunity
The map scrolls sideways.
The problem to solve
Small teams need to deploy and monitor without a dedicated expert, because every hour spent on infrastructure is taken from the product. Today, cloud consoles assume you already know where to look.
The questions the design answers
Q1
How might we take a service live in minutes, without configuration?
Why this one · The low point of the experience map is choosing and configuring.
Q2
How might we say on one screen whether all is well?
Why this one · Mathis wants an answer within a minute.
Q3
How might we make the cost predictable?
Why this one · The month-end bill is the other low point.
Q4
How might we run an incident and warn customers from one screen?
Why this one · Julien's need, on the team side.
04 · Ideation
What the first version keeps
Impact ↑
Quick wins · Impact high · Effort low
Project detection from the repoIn V1
Q1
Home: health, cost, actionsIn V1
Q2, Q3
Live deployment stepsIn V1
Big bets · Impact high · Effort high
Autoscaling by defaultIn V1
Internal incident consoleIn V1
Q4
Logs and searchIn V1
Nice to have · Impact low · Effort low
Dark modeIn V1
Two-mode variables
Later · Impact low · Effort high
Visual infrastructure editorLater
Extension marketplaceLater
Effort →
Impact and effort estimated: a designer's ranking.
Creating a service
Start
Services
“New service”
Screen
Source
Repo and branch
System
Detection
Language, build and port filled in
Screen
Resources
Size, autoscaling, variables
Screen
Summary
Estimated monthly cost
Decision
Build passed?
No: build logs, fix, push again
Screen
Deployment
Live steps
End
Service live
Address and first chart
Low-fidelity wireframes
01 · Dashboard
02 · New service
03 · Incident
04 · Pricing
05 · Design
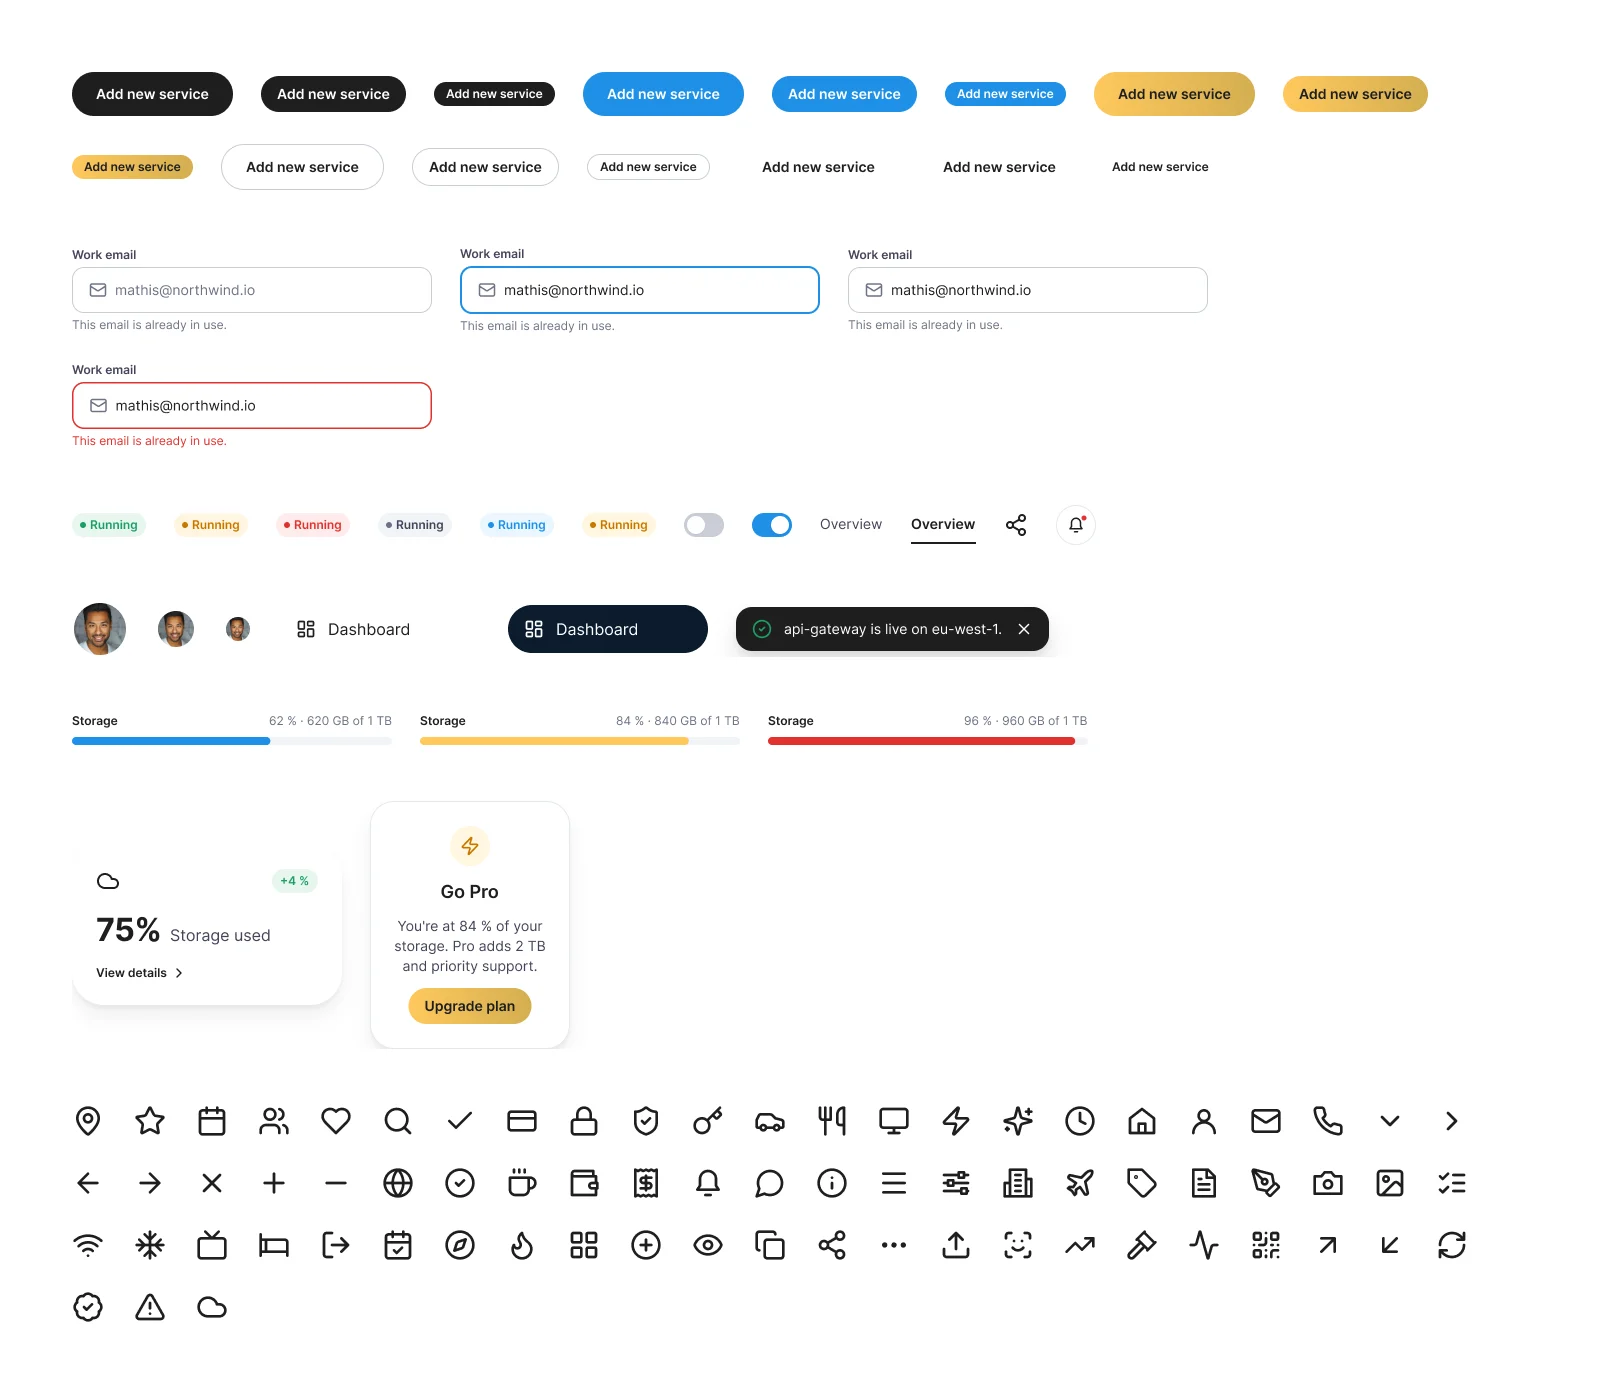
A light system, and its dark mode
Inter alone, a blue for action, semantic statuses: the app runs light, the site dark, both on the same variables.
Colours
Canvas
#F7F9FC
Console background
Surface
#FFFFFF
Cards, tables
Accent
#1F8FE5
Action, charts
Accent subtle
#EAF6FF
Selection, banners
Text
#1E1E1E
Headings and text
Secondary text
#454459
Captions
Success
#1E9E63
Live, deployed
Warning
#C77700
Threshold, degraded
Danger
#E0322F
Error, incident
Success subtle
#E6F6EE
Status fill
Type
Display
Inter ExtraBold 64
Transform your cloud experience
Heading 2
Inter Bold 32
Everything you need to ship
Number
Inter Bold 32
99.98 %
Body
Inter Regular 16
Push to main and your service is live.
Code
Inter Medium 13
npm run build
29 components
- Logo
- Button
- Badge
- Input
- Toggle
- Tab
- Avatar
- Nav item
- Upgrade card
- Sidebar
- Icon button
- Top bar
- Stat card
- Segment
- Usage meter
- Table header
- Service row
- Toast
- Line chart
- Donut
- Legend
- Bars
- Site nav
- Partner logo
- Feature card
- Pricing card
- Testimonial
- FAQ
- Footer
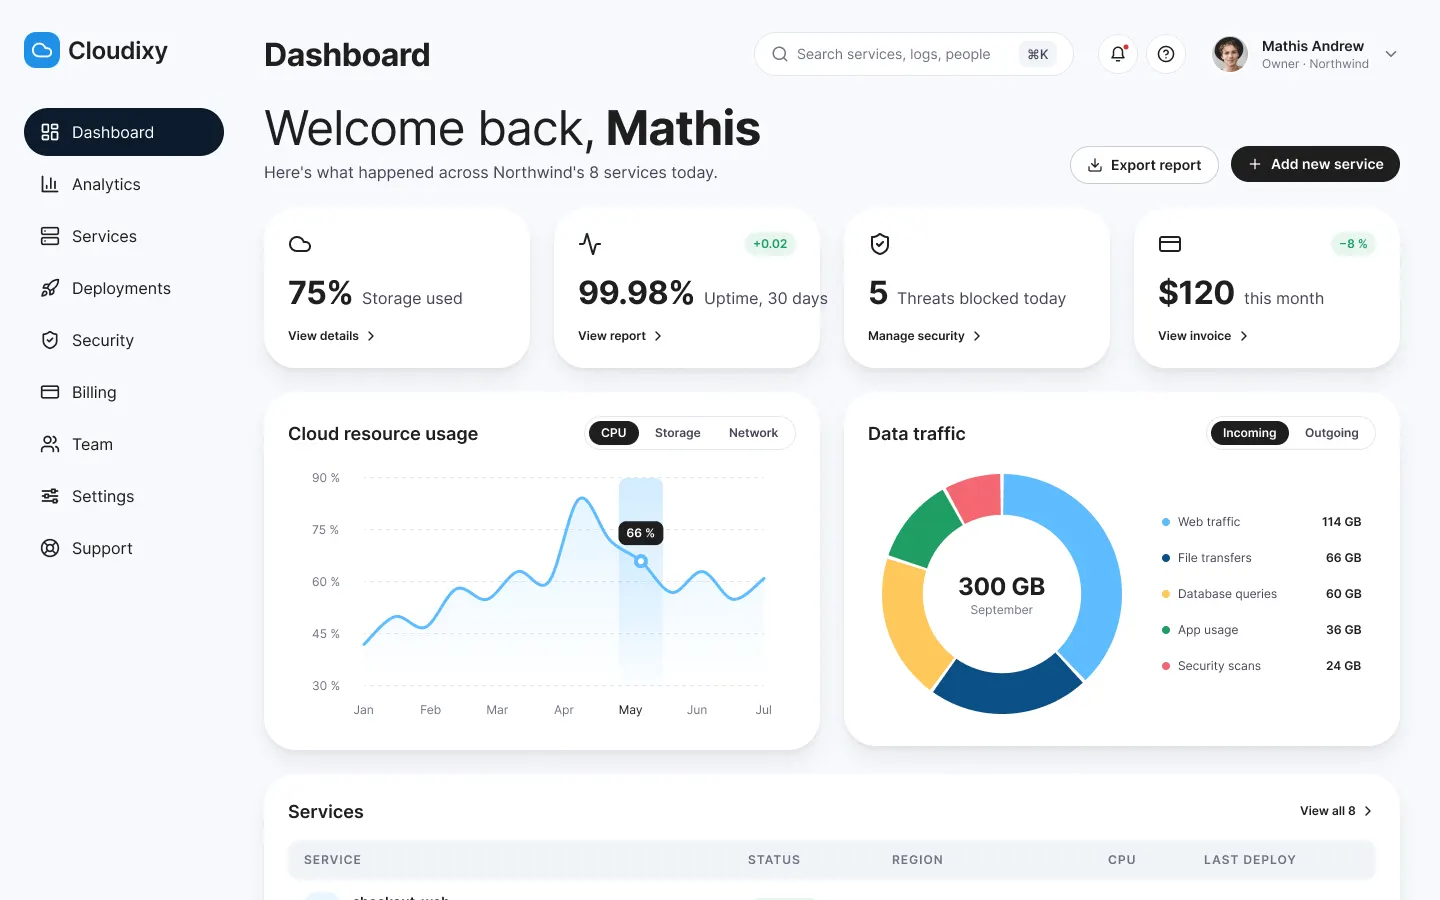
The dashboard: what happened, and what to do
First iteration
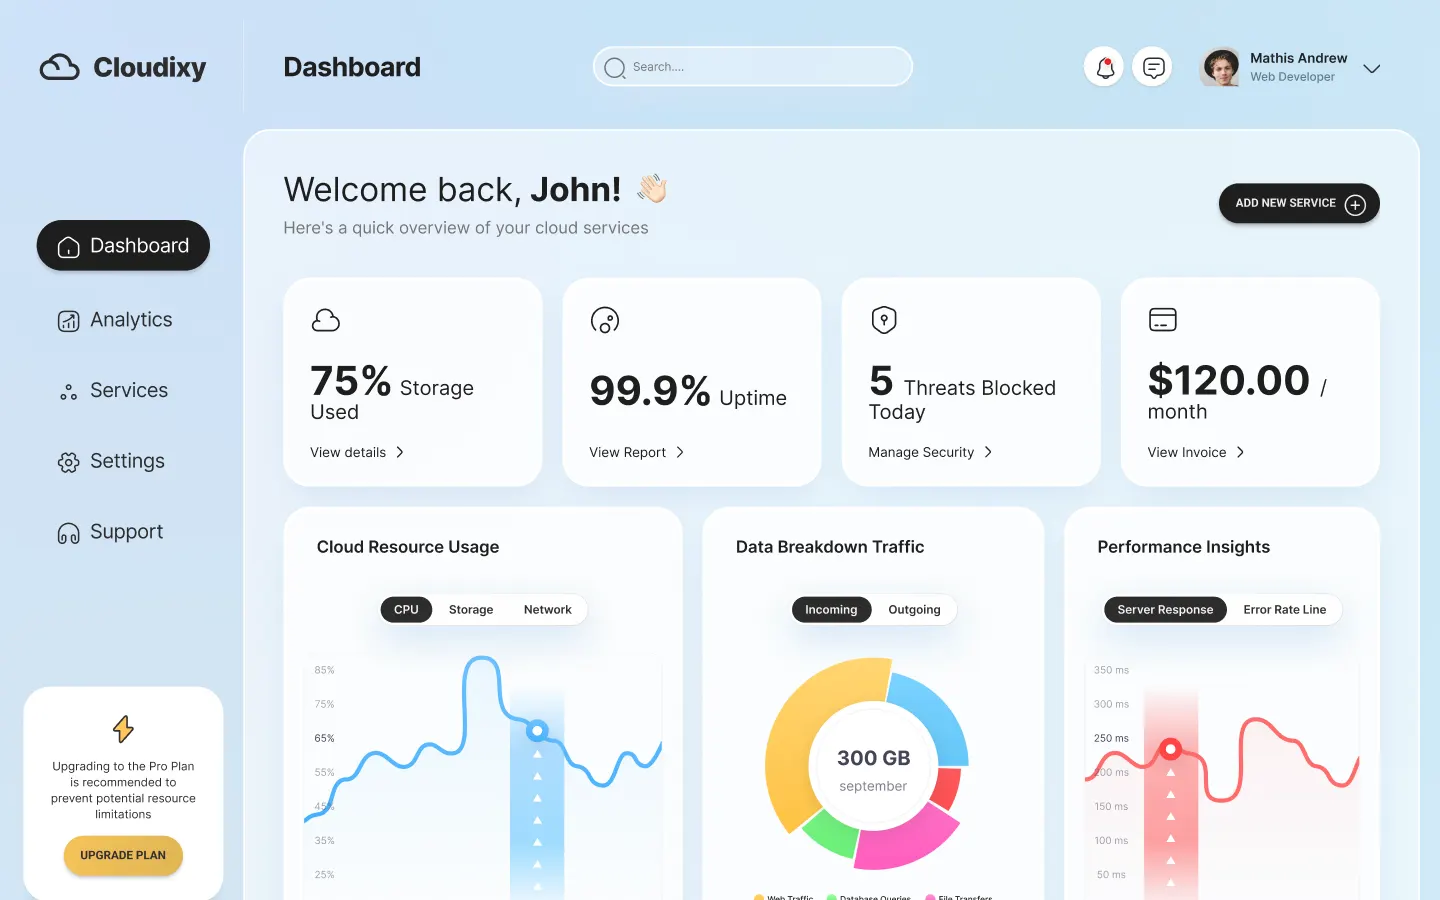
Final version
What changes
The welcome line says what happened today across the eight services.
UX law · Serial Position EffectKept
Every indicator keeps its change and its action: details, report, security, invoice.
UX law · Law of ProximityKept
The full menu, grouped: services, deployments, security, billing, team.
UX law · Jakob’s LawKept
One filled button: add a service.
UX law · Von Restorff EffectKept
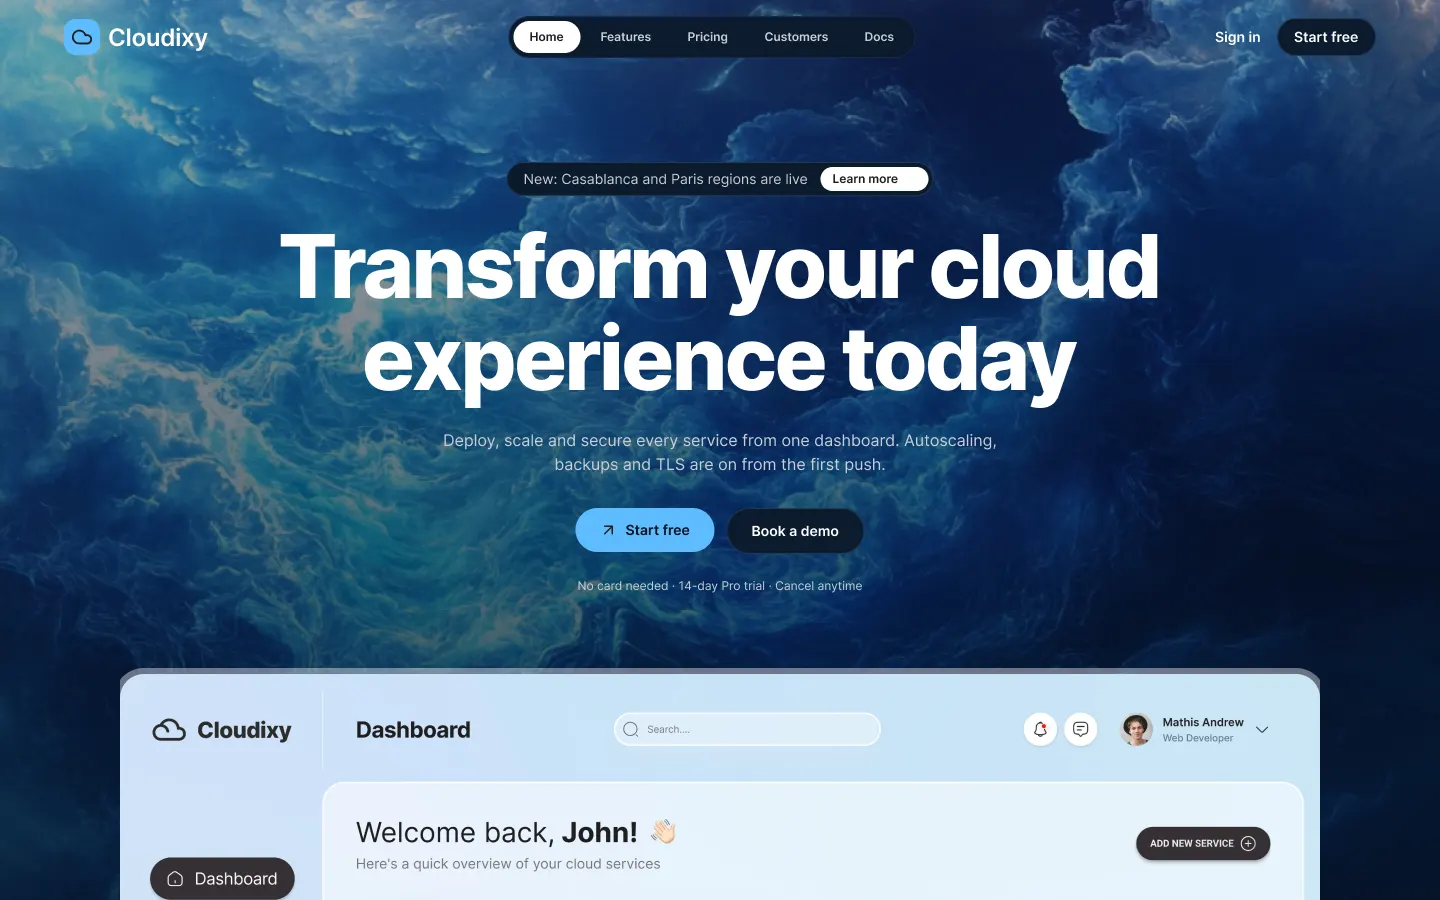
The site: say what the product does
First iteration
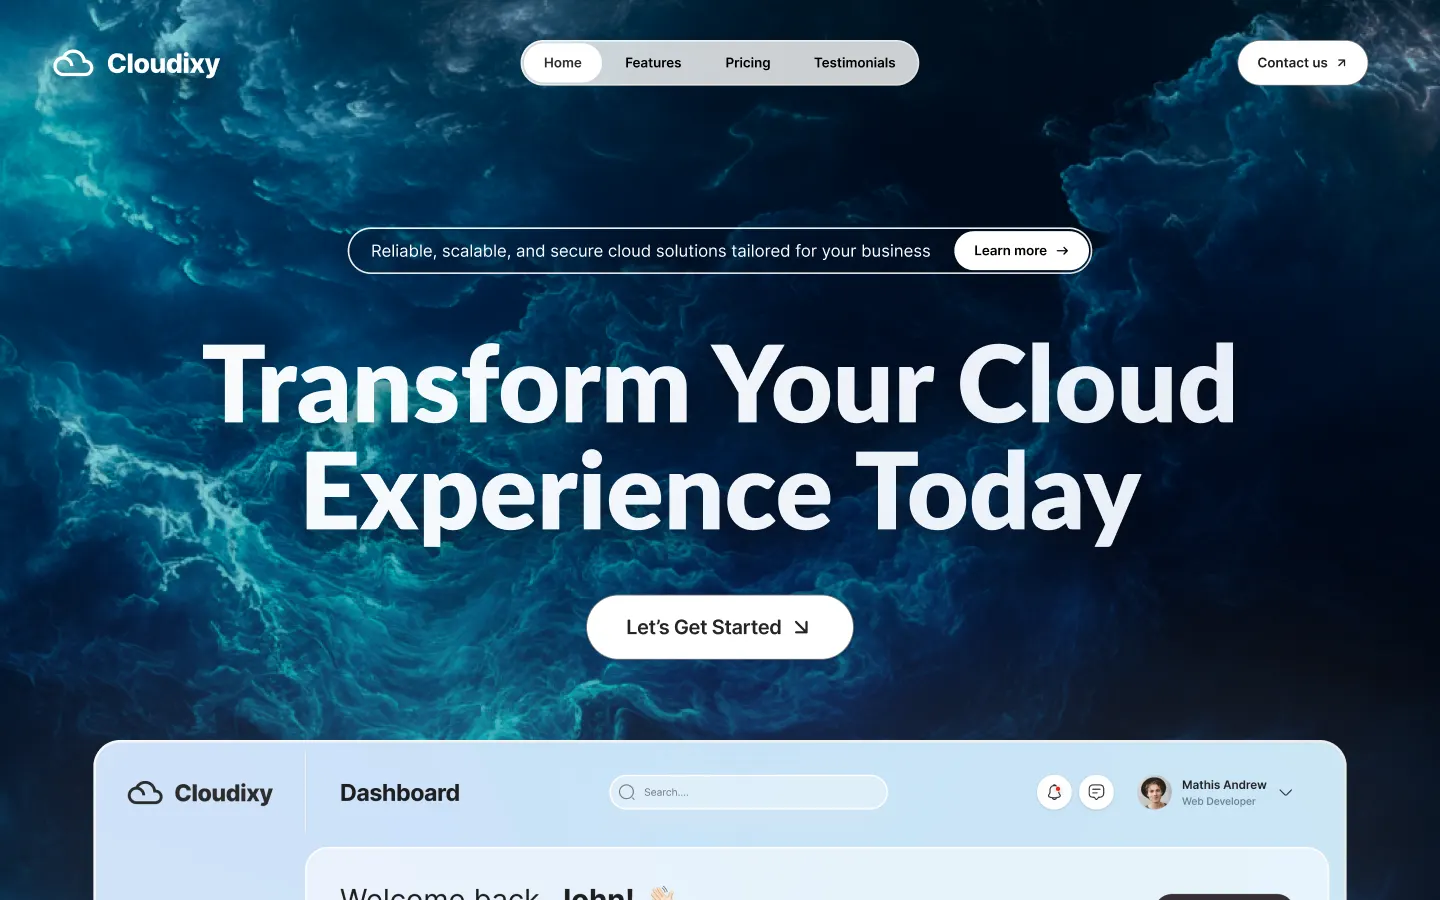
Final version
What changes
The subtitle says what the product does: deploy, scale, secure.
UX law · Jakob’s LawKept
Two actions and their terms: free trial, demo, no card.
UX law · Loss AversionKept
The console shows from the first screen: you see what you buy.
UX law · Aesthetic-Usability EffectKept
The customer console
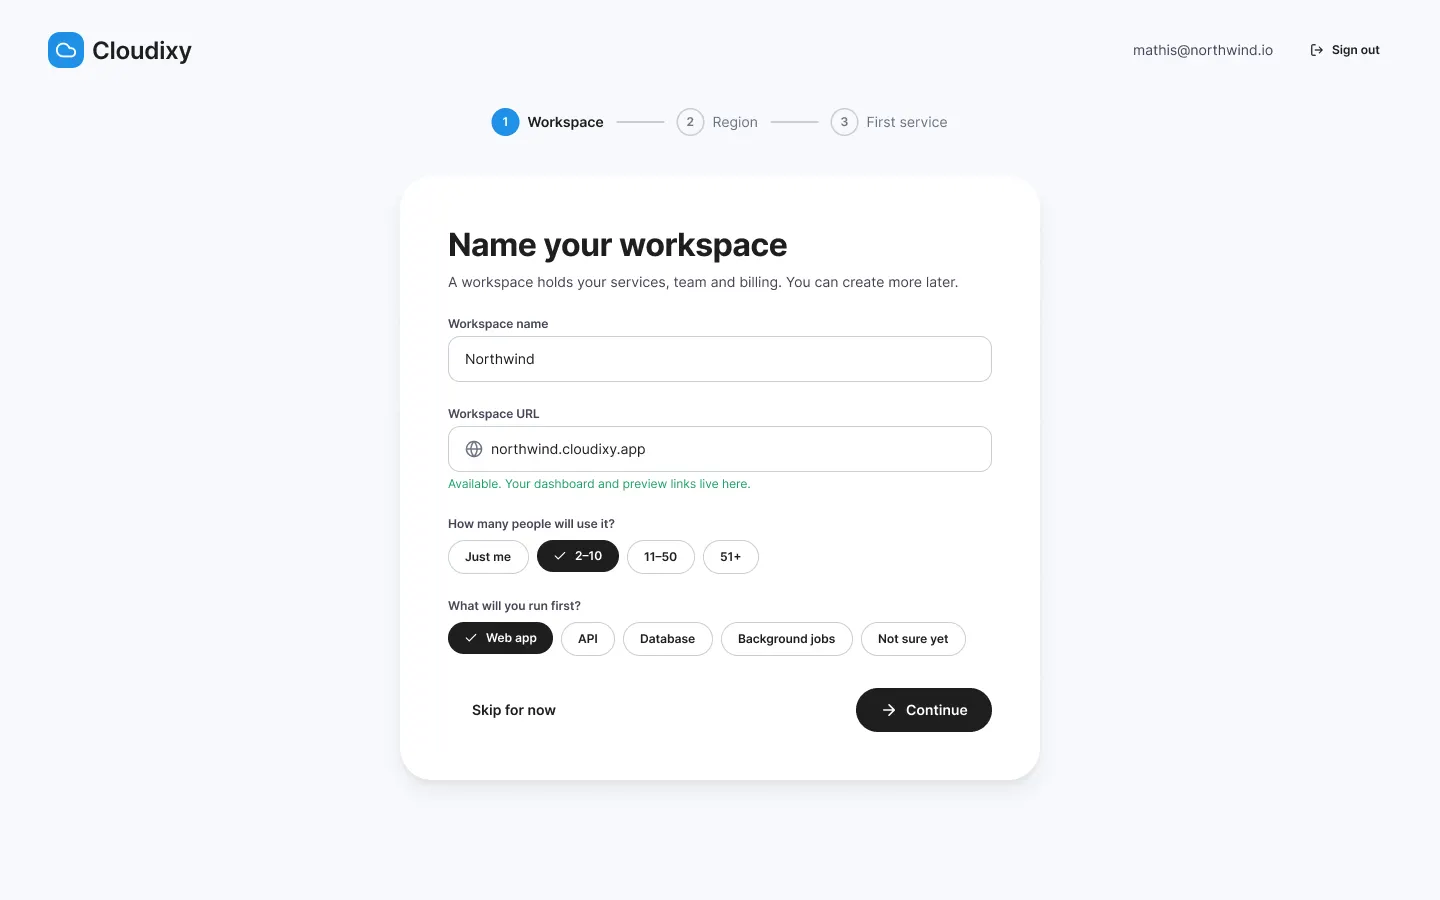
Onboarding
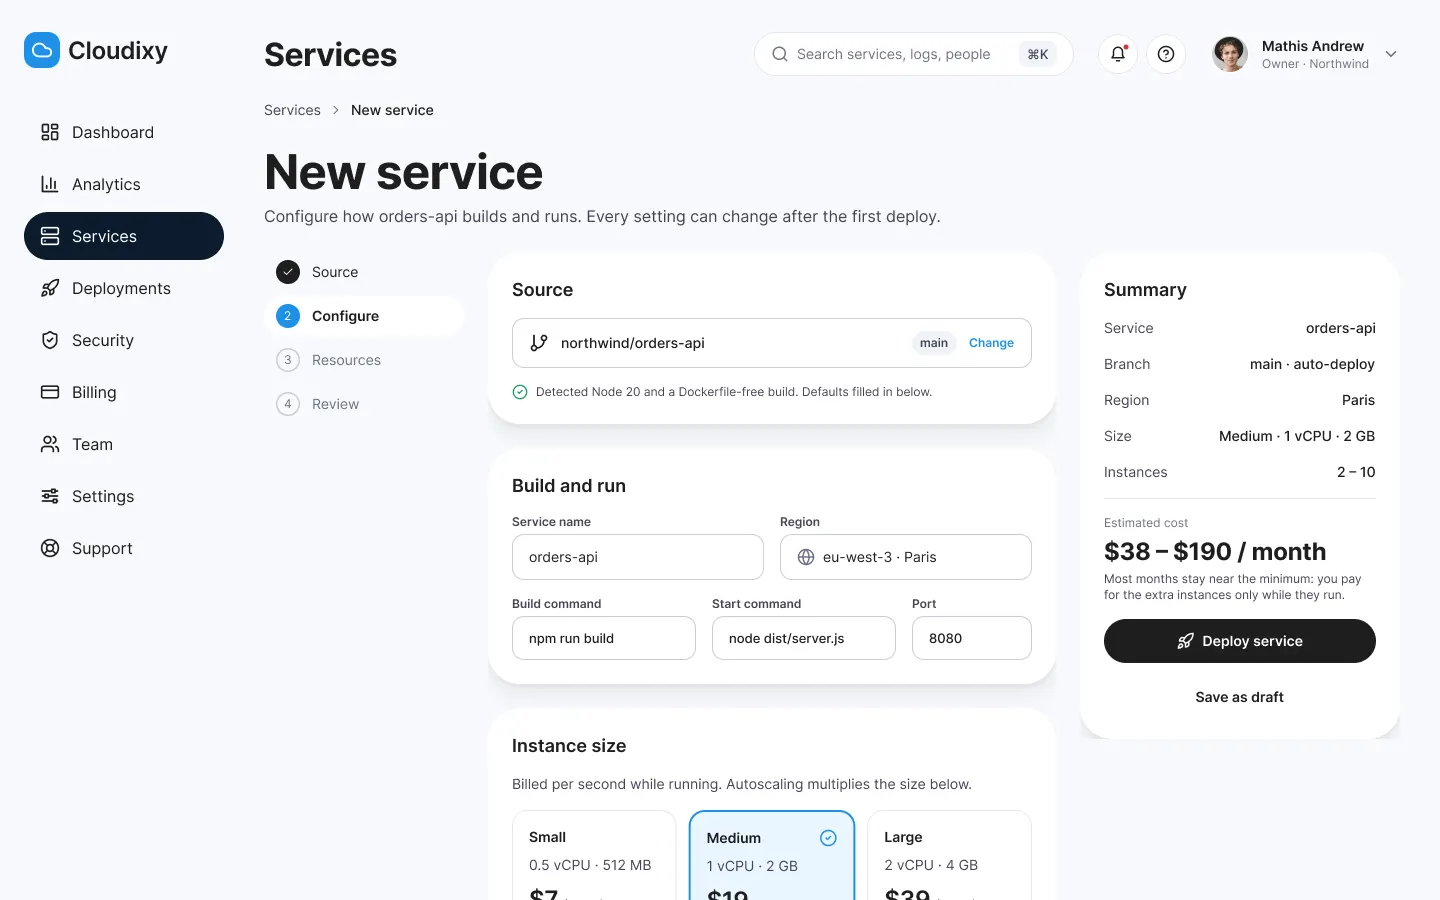
New service
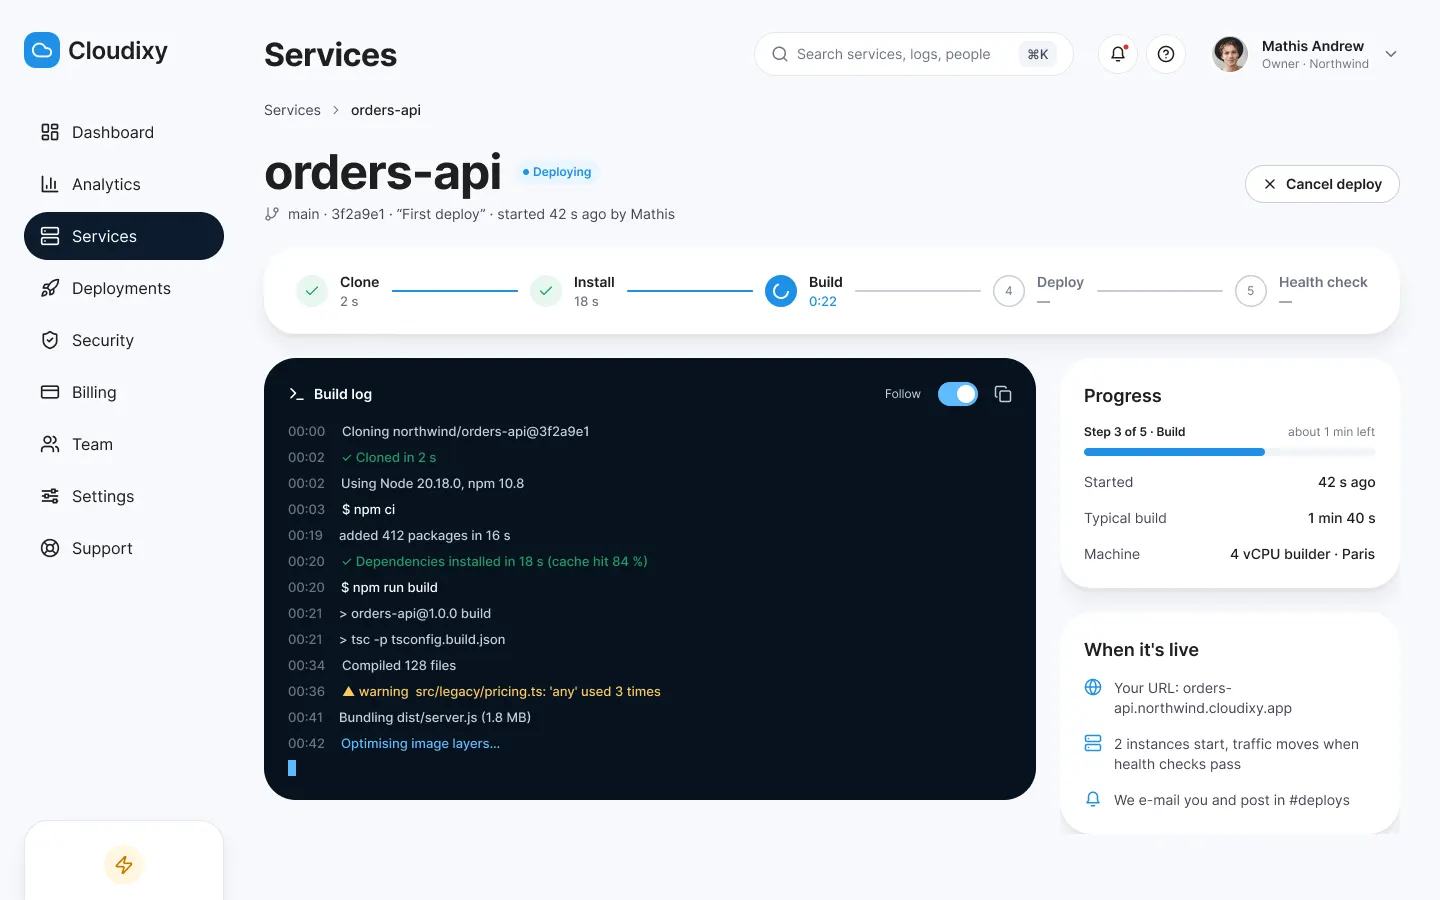
Live deployment
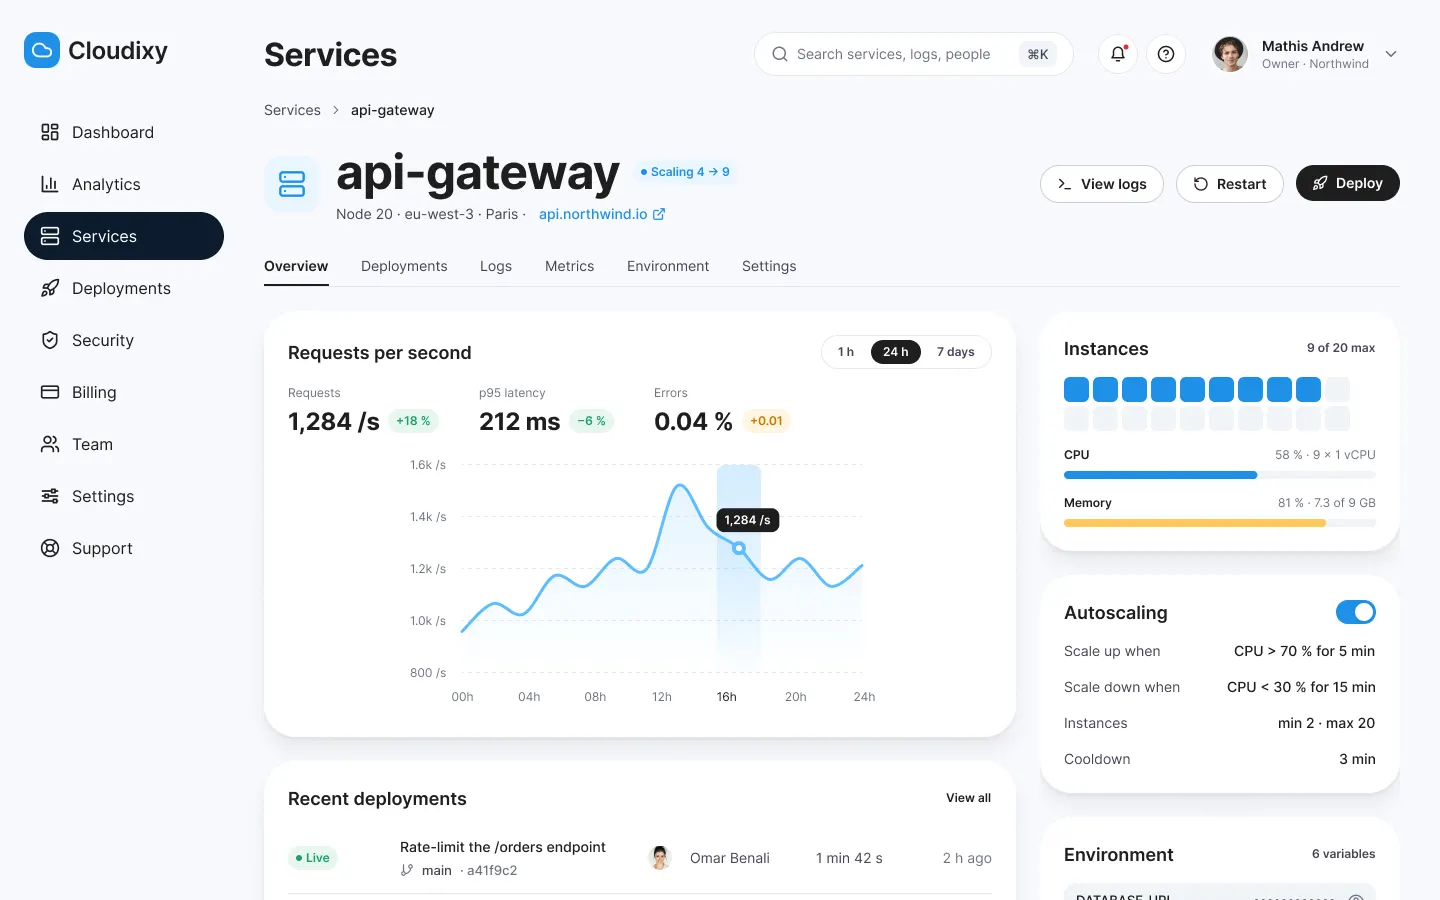
Service details
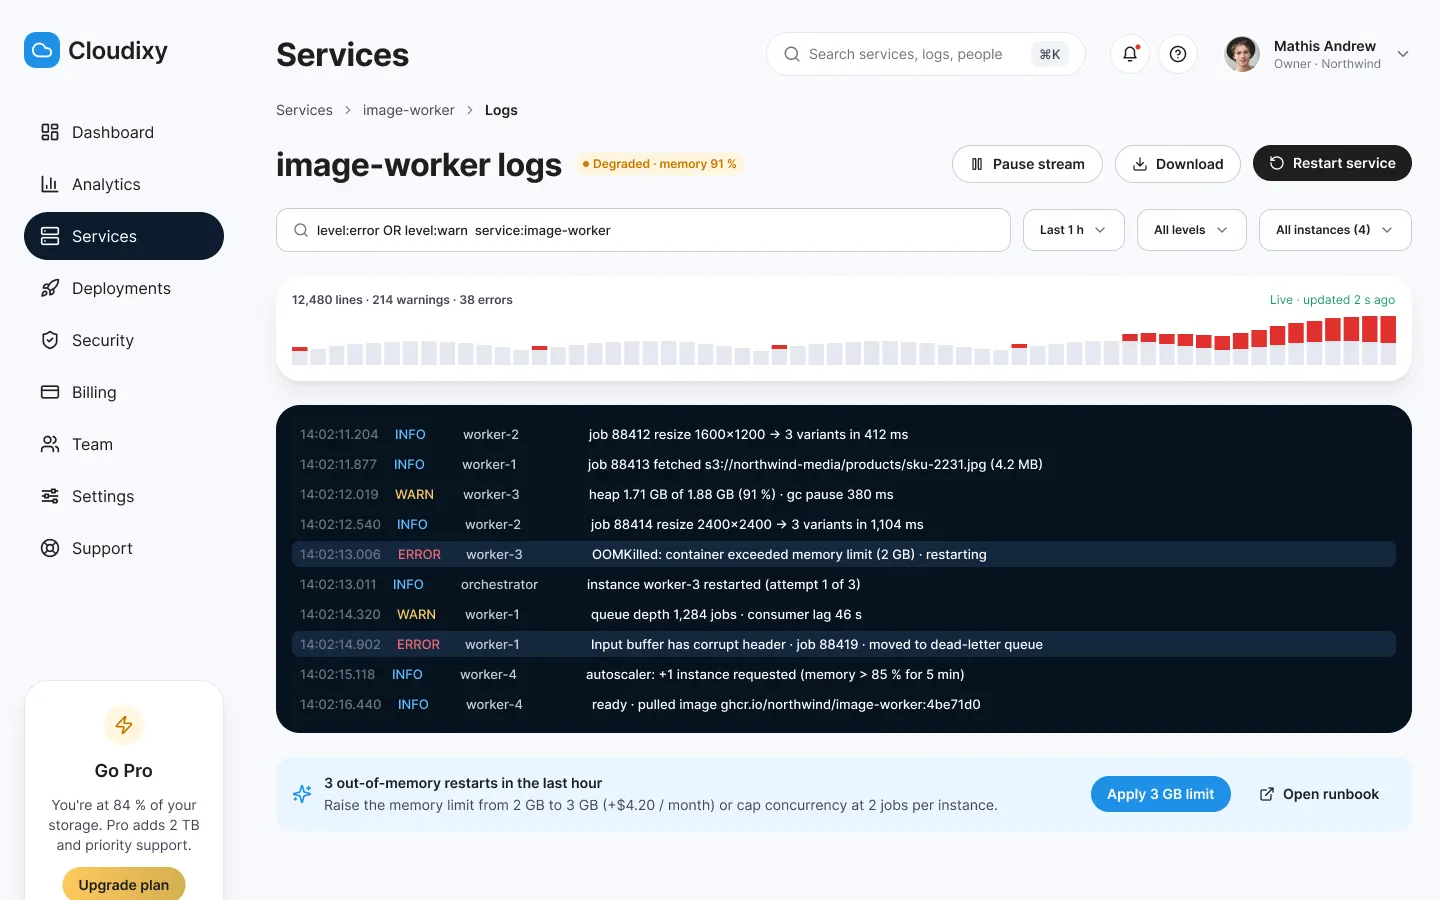
Logs
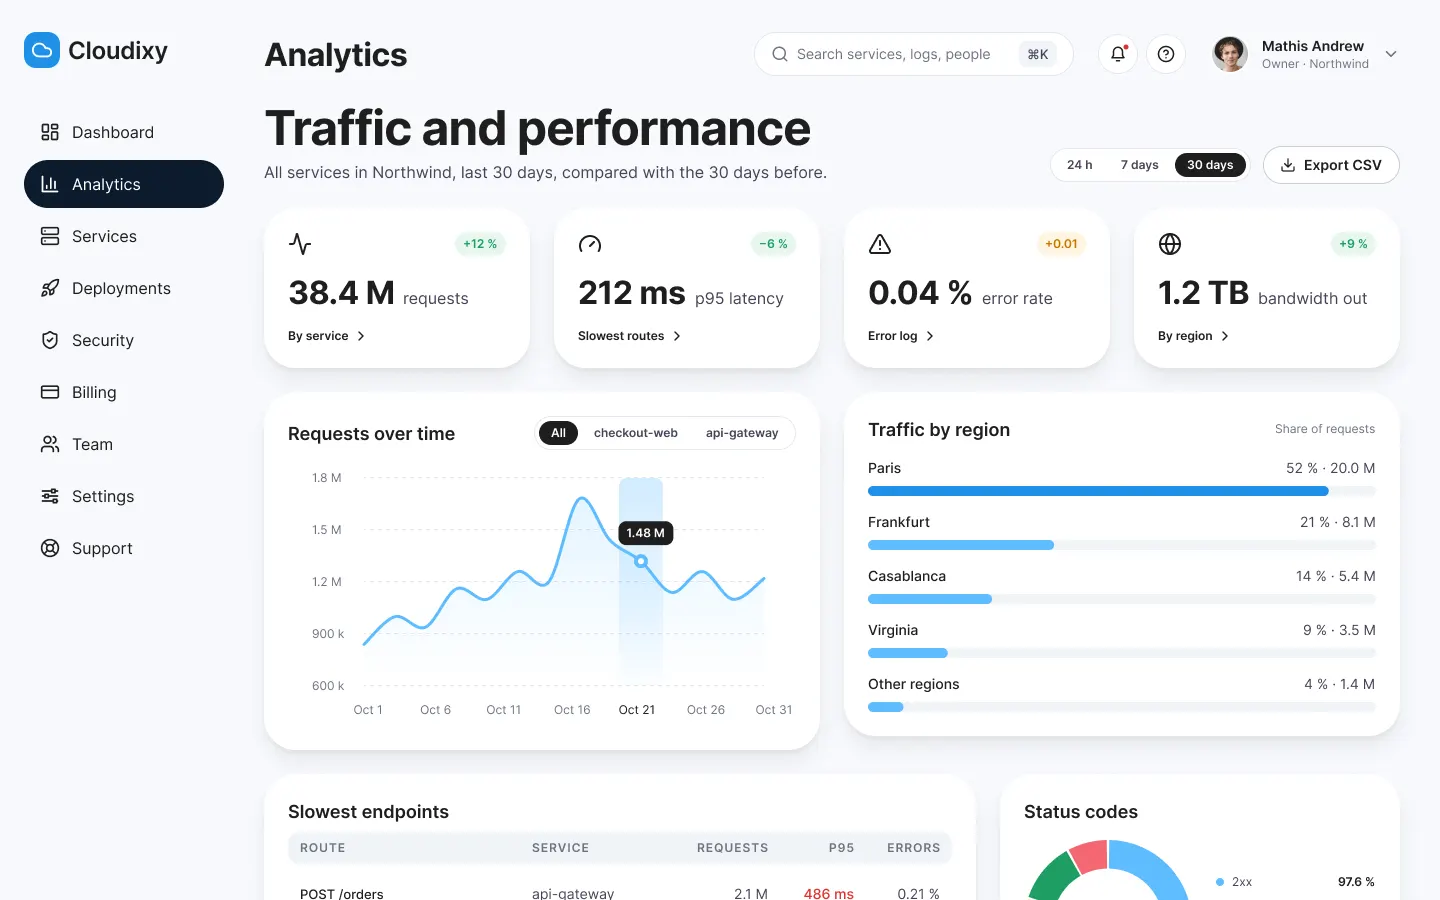
Analytics
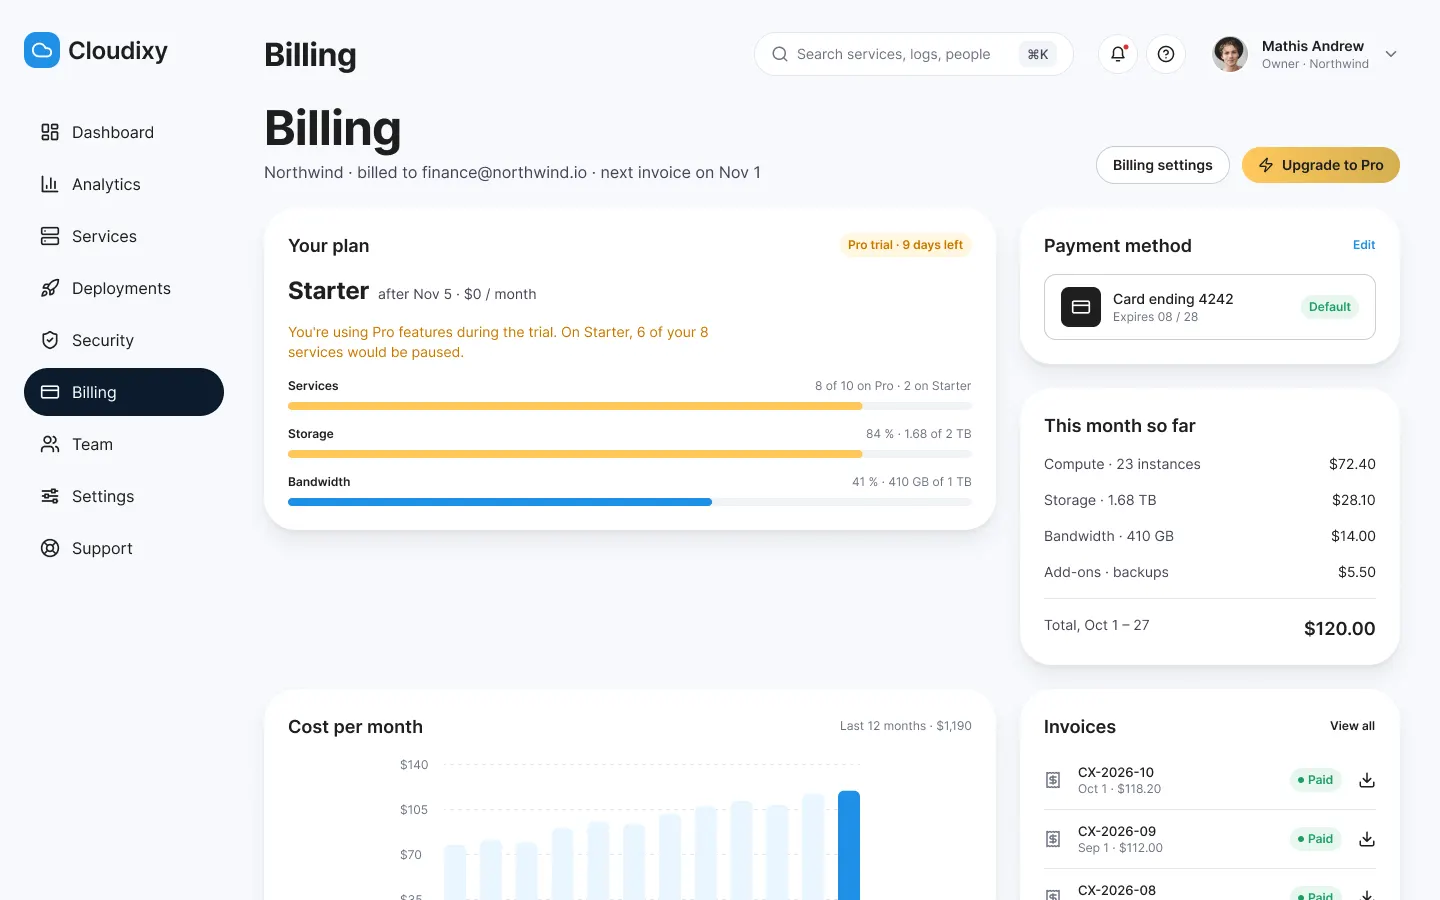
Billing
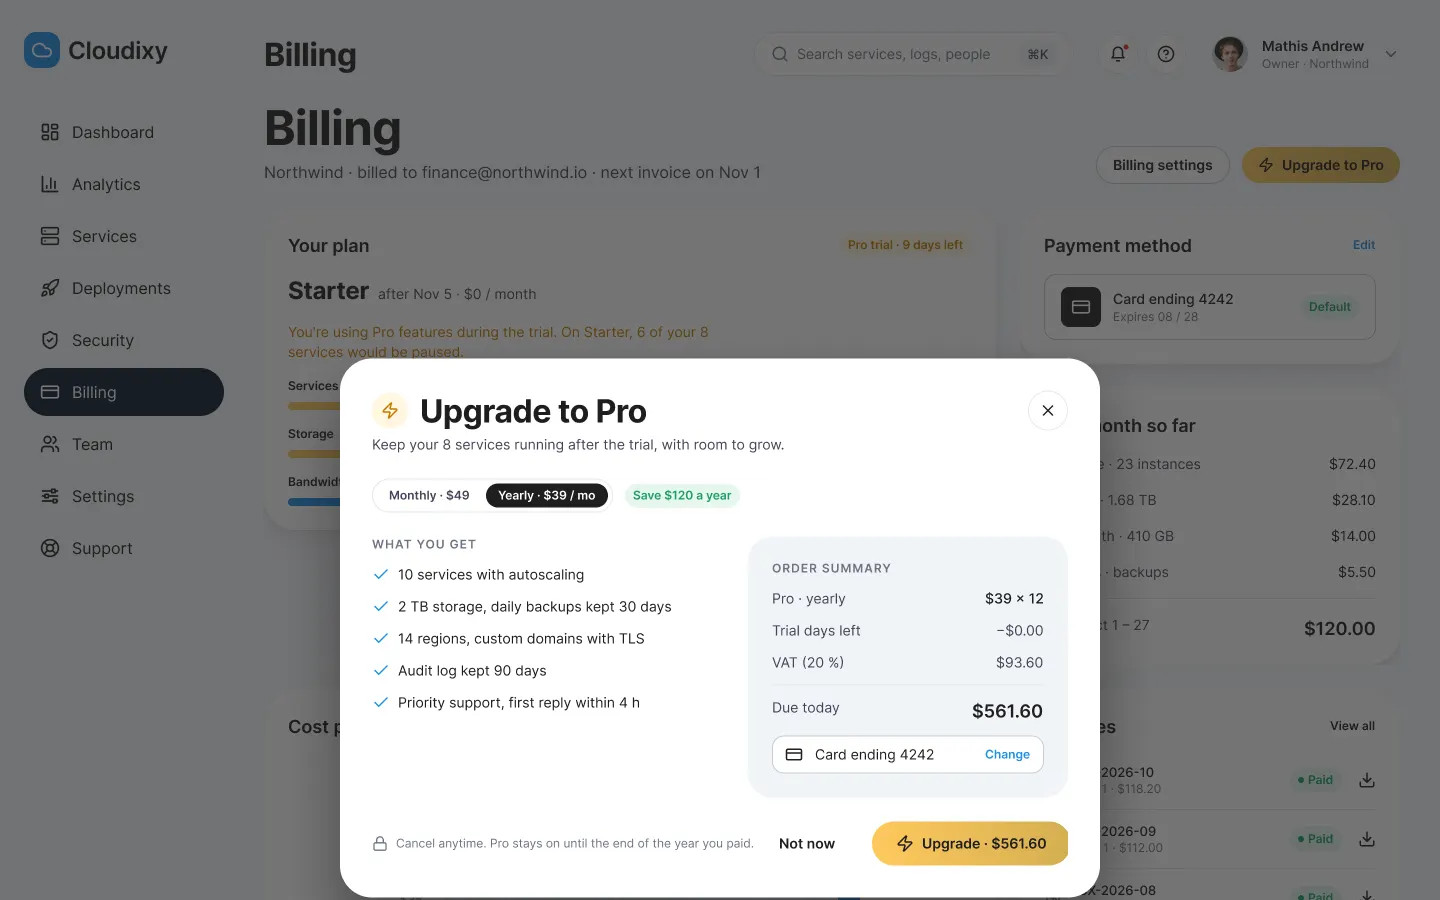
Upgrade to Pro
When it breaks
Q4: the incident as the customer sees it, then the on-call team, and the public status page.
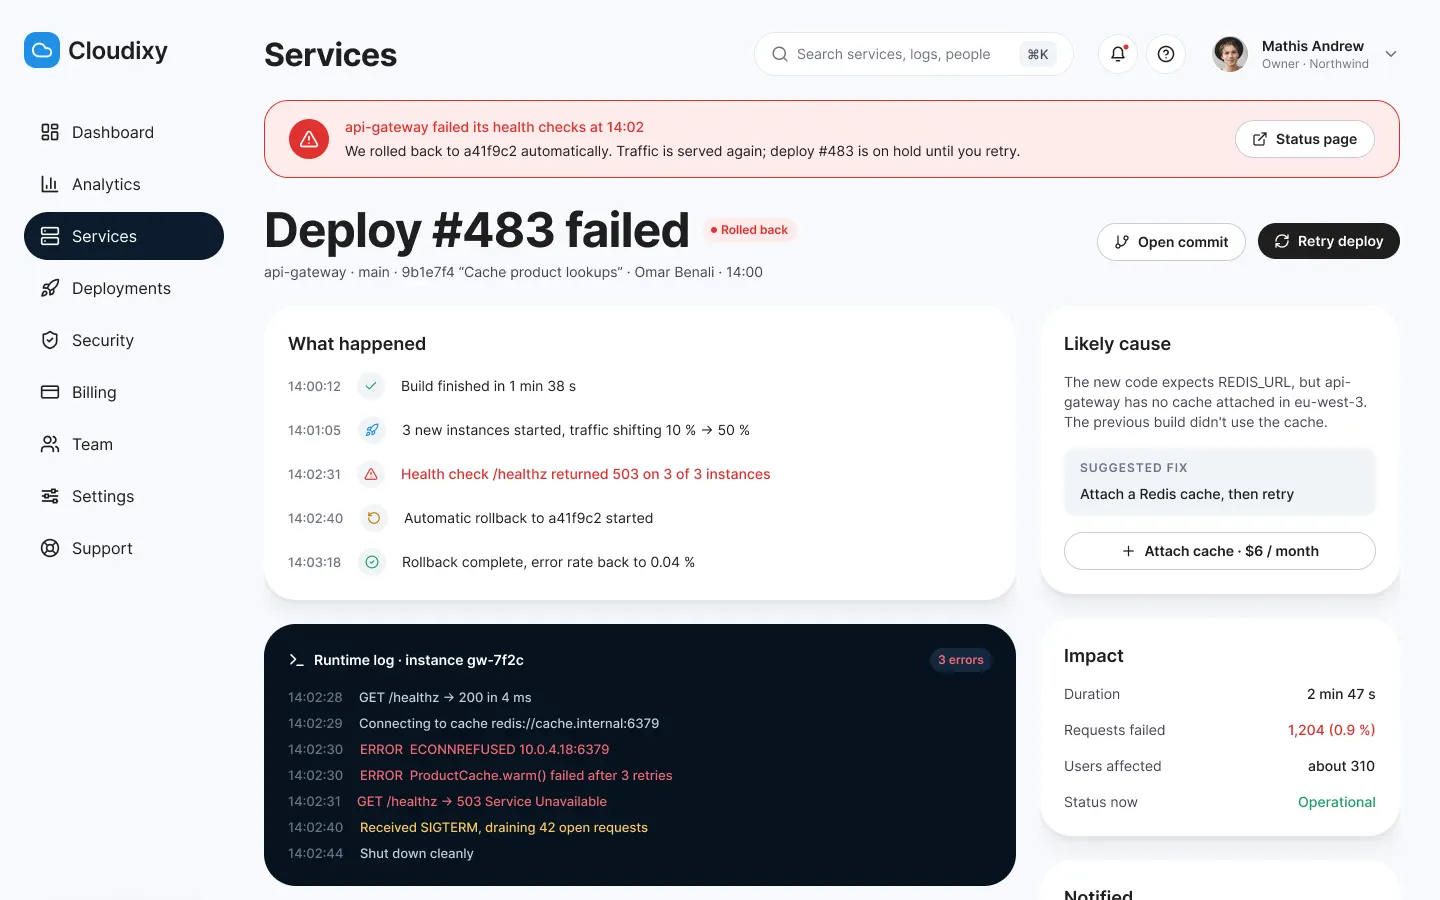
Customer side
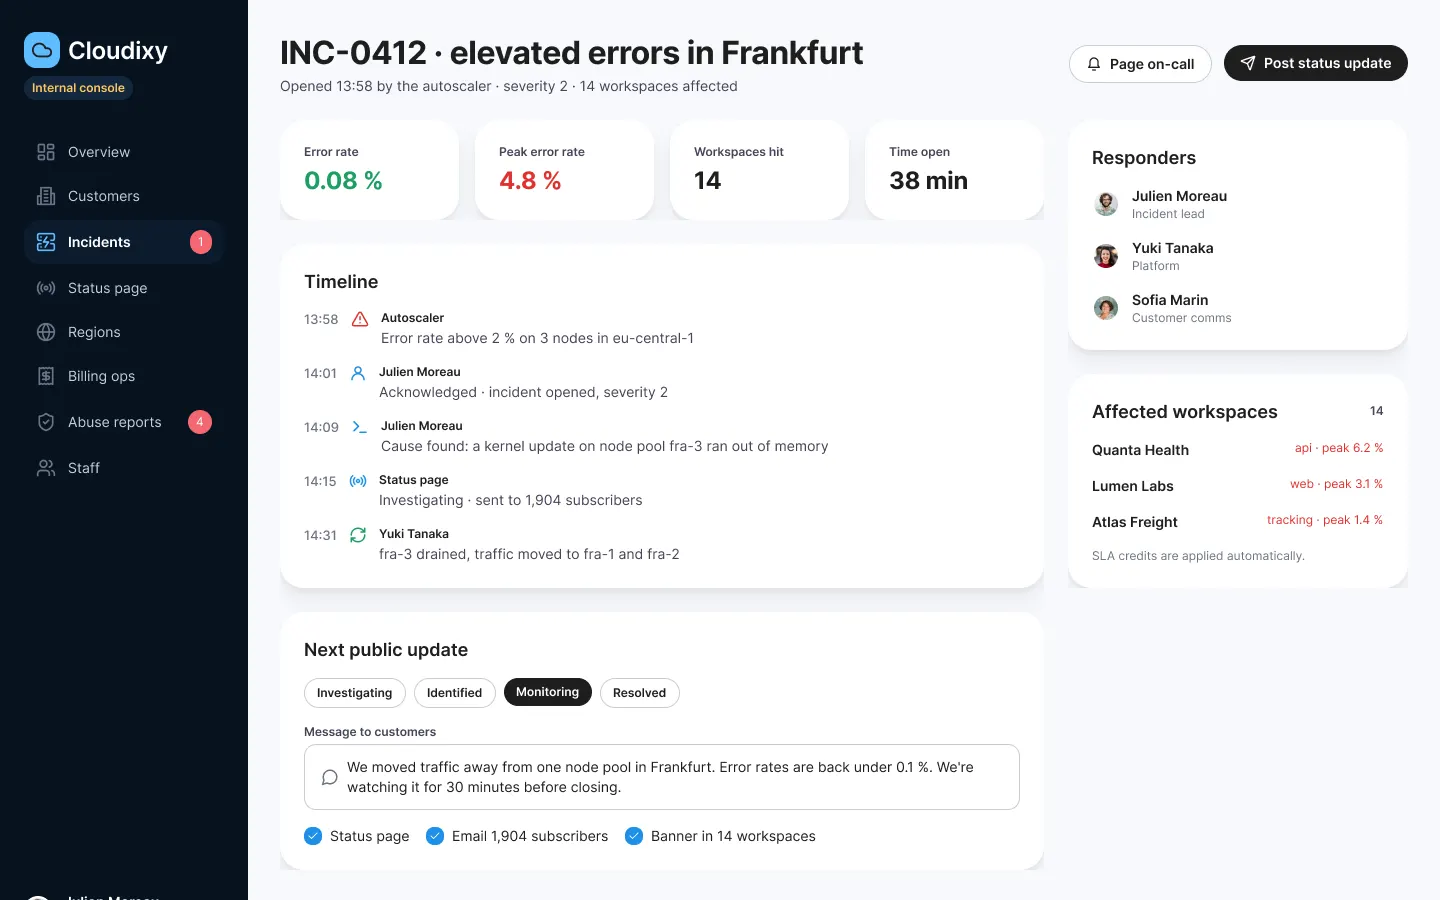
Internal console
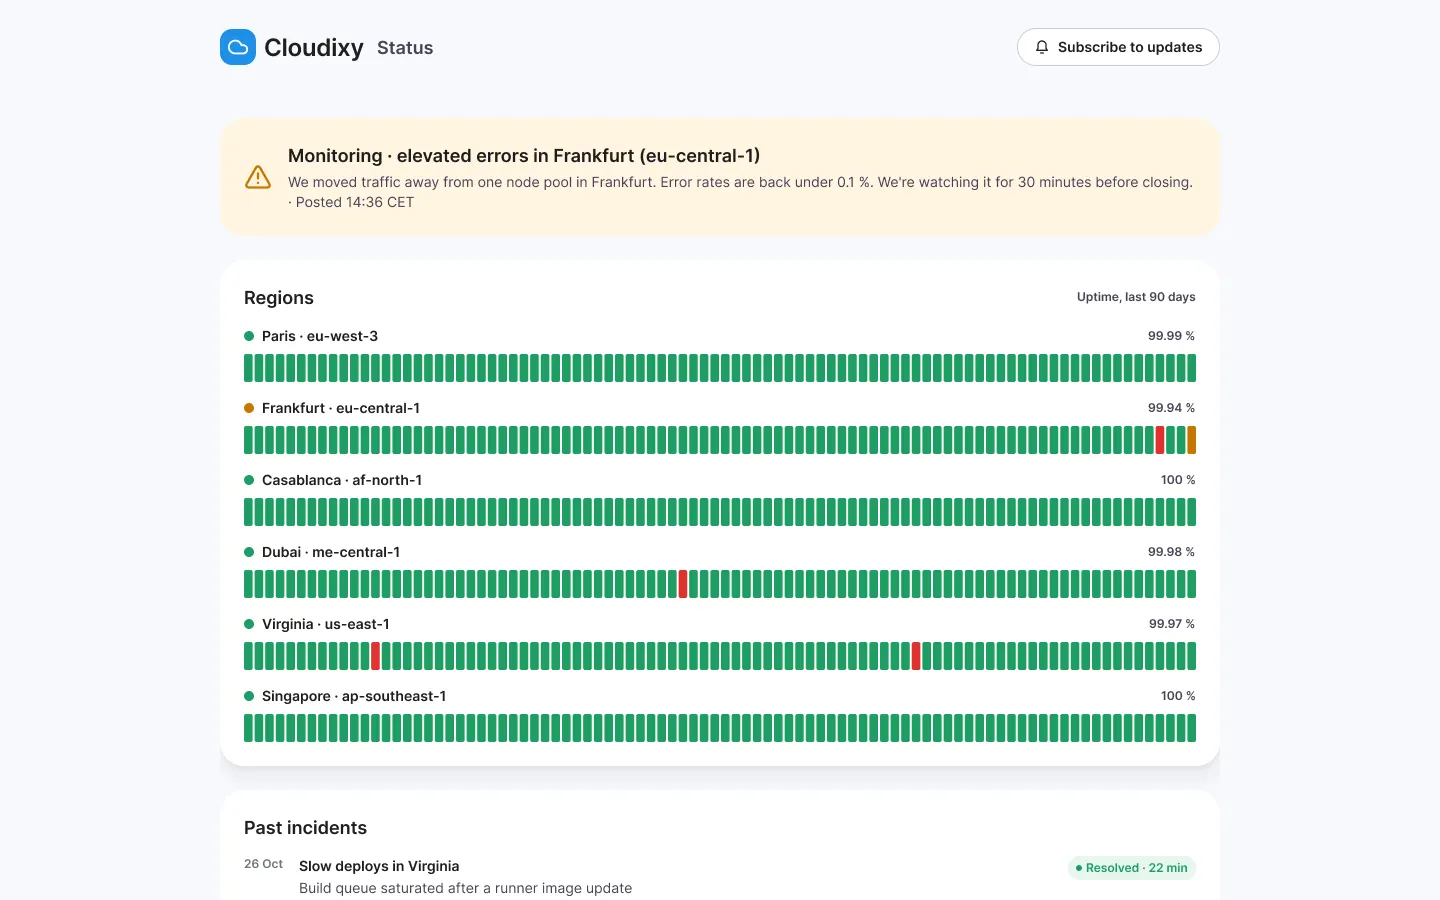
Status page
06 · Validation
UX laws at work
- Kept
Tesler’s Law
Complexity never disappears, someone carries it: let it be you.
Complexity stays in the platform: build and port are detected.
New service
- Kept
Doherty Threshold
Under 400 ms, the system feels like a conversation.
Every step answers live, the wait can be read.
Deployment
- Kept
Law of Proximity
What sits together reads together.
A number, its change and its action in the same card.
Dashboard
- Kept
Von Restorff Effect
The one thing that differs is the one thing remembered.
One filled button per screen.
Everywhere
- Kept
Miller’s Law
Working memory holds about seven items: chunk the rest.
Ten entries, in three readable groups.
Menu
- Kept
Peak-End Rule
People judge the peak and the end, not the average.
An incident ends with a clear message and credits applied automatically.
Incident
Expected results
What a test and a launch should show. Nothing has been measured.
| Expected result | Indicator | Indicative target |
|---|---|---|
| A first service live, fast | Time from sign-up to the first live service | Under 10 min (hypothesis) |
| State understood at a glance | Testers who say whether all is well within 30 s | 5 out of 5 in testing |
| Costs without surprises | Gap between estimated cost and invoice | Under 10 % (hypothesis) |
| Incidents announced sooner | Time from opening to the first customer message | Under 15 min (hypothesis) |
The test that would validate the console
ParticipantsFive developers from teams under fifteen people, without an infrastructure engineer, in 45-minute remote sessions on the prototype.
01
TaskCreate an account and take the orders-api service live.
Success criterionLive without help, defaults kept.
02
TaskSay whether all is well today, and what the month costs.
Success criterionRight answer within 30 seconds.
03
TaskFind why the last deployment failed.
Success criterionError line found in the logs.
04
TaskOn call: post an incident update.
Success criterionMessage sent to affected customers from one screen.
Interview questions
- Tell me about your last deployment that went wrong.
- How do you know today what your infrastructure costs?
- What do you expect from a provider during an outage?
What I take from it
01
A dashboard is an answer
Each card answers one of Mathis's questions; a chart with no action was removed.
02
Draw the team behind it
The internal console changed the customer console: incident banner, credits, status page.
03
Two modes, one system
Two-mode variables gave a dark site and a light app without duplicating a component.
Got a project in mind?
Describe the screen or the workflow that gets in the way: I reply with a first reading of the problem.